Amit Indap Bioinformatics & Data Science Blog
Musings on Bioinformatics, Data Science, Python, R, and more.
CellXGene Census data processing pipeline with Nextflow
by Amit Indap
In an earlier post, I talked about using GitHub Actions to build and push Docker images. But I didn’t talk about what code was in the Docker image and what is was doing. That’s what this post is for.
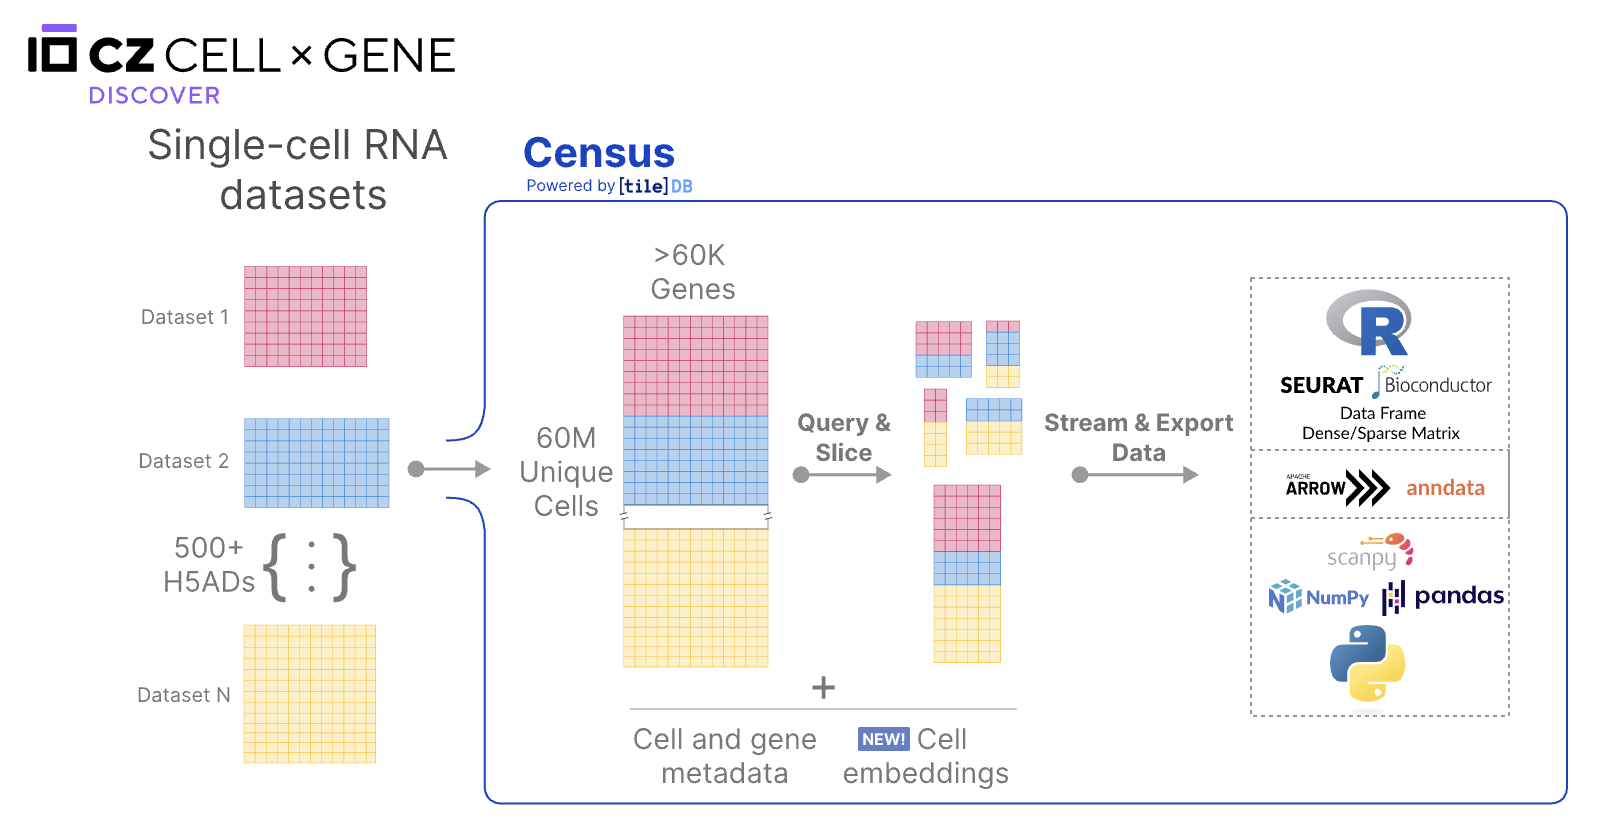
I’m a big fan of CellXGene, an open-science resource of single-cell transcriptomics data. It has tools and APIs to analyze and visualize single-cell RNA-seq data. CellXGene Census is an API that allows users to programmatically access the CellXGene data.
I used the Census Python API to calculate average gene expression and percentage of cells expressing a gene in a particular tissue and cell type.
Data processing pipeline
I followed the data processing and normalization methodology outlined in the CellXGene publication:
-
Removal of duplicate cells: Some data maybe duplicated across dataset submissions. You can select data that is listed as primary for analysis
-
Removal of low-coverage cells: Cells with less than 500 genes are not considered for analysis.
-
Removal of cells based on sequencing assay: Only data that do not require gene-length normalization are included
-
Data Normalization: Using the Census API, the raw counts are normalized to log-transformed pseudocounts. In particular, the raw counts are normalized using
Ln(CPPT+1)where CPPT is counts per ten thousand. When doing a query for a particular tissue and cell type, the normalized counts are concatenated across all datasets. -
Removal of noisy data: After normalization, counts less than or equal to 3 are set to 0. The authors do this for providing a cleaner visualization of the data.
Cell ontology rollup
Cell types in CellXGene are mapped onto the Cell Ontology (CL), which is a tree structure that describes the relationships between cell types. The Cell Ontology is a controlled vocabulary for describing cell types and their relationships. The Cell Ontology is used to “roll up” cell types into broader categories. For example, the cell type “B cell” is a child of the broader category “lymphocyte”.
When doing a query for a particular tissue and cell type, I use the the Owlready2 package to navigate the Cell Ontology. For example, if you query for “B cell” in “blood”, the results will include all B cells in blood, as well as all lymphocytes in blood. This allows for a better measurement of gene expession metrics of low-granularity cell types annotations. CellXGene also has a nice cell guide that shows the relationships between cell types and their parent categories on the Cell Ontology that are in the Census.
Python implementation of data processing pipeline
The steps described above are implemented in Python using the cellxgene-census package. The package utilizes TileDb-SOMA, which is an open-source API for working with single cell data. I’m a big fan of TileDB, but I’ll save the details for another post. But you can read about TileDB-SOMA here.
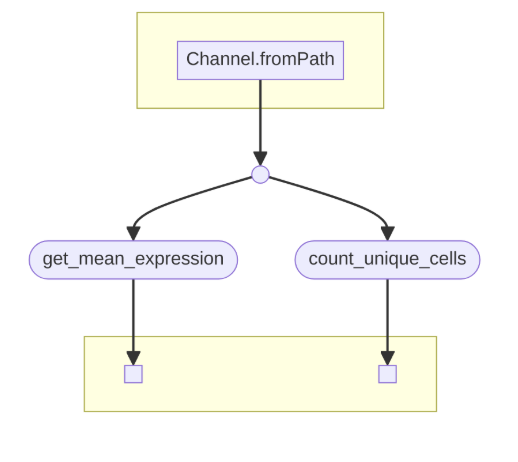
Nextflow pipeline
The Python script is wrapped in a Nextflow pipeline, which you can read more about here. But essentially, given a samplesheet of cell types and tissues, the Nextflow pipeline will run the Python script for each cell type and tissue combination. The output is a CSV file with the average gene expression and percentage of cells expressing a gene in a particular tissue and cell type. The Python code is baked into a Docker image, which is built and pushed to Docker Hub using GitHub Actions, as described in my previous post The Docker image is then pulled and run on AWS Batch using Nextflow.
The easiest way to run this pipeline in production is on Seqera Platform. I personally recommend setting up Batch Forge. Note, you need to have your own AWS account to set this up and you will be charged for the resources you use.
Running the pipeline on Seqera Platform proved to be much easier. I had originally called my Python script via a bash script using nohup on a rather large EC2 instance. Running it with AWS Batch proved a lot faster and cheaper because I can run multiple jobs in parallel.
Conclusion
CellXGene is a great open science resource for single-cell transcriptomics data. The Census API powerful way to access the data programmatically. I was able to impelment a data processing pipeline using Python and Nextflow to calculate gene expression metrics and deploy it on Seqera Platform.
I’m a big fan of CellXGene and TileDB-SOMA for analyzing single-cell transcriptomics data. I hope to continue to work with these APIs in the future to help analyze and visualize single-cell data.
See my GiHub repo that has the Nextflow workflow and Python code here: indapa-CellXGene